
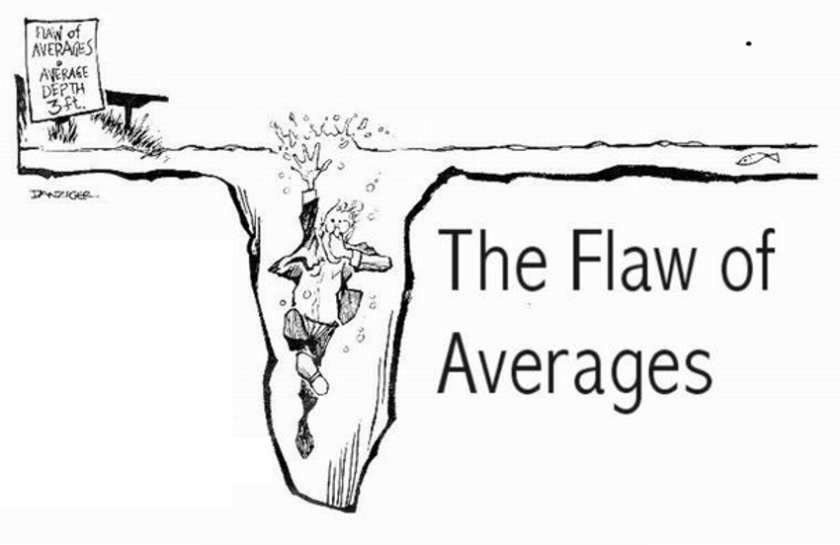
This short blog is inspired by Mark Denny’s recent publication, “The fallacy of the average: on the ubiquity, utility and continuing novelty of Jensen’s inequality” in JEB. It was something I had given only fleeting thoughts to with regards to my own work, but it was something I didn’t even knew had a name, let alone several (e.g. “Jensen’s inequality,” “the flaw of the average,” “the ecological fallacy”). It’s relevant to a lot of different fields, so it’s useful to keep in mind.
The basic, most essential definition of the fallacy of the average is this:

This equation basically says, the average of the function does not equate to the function of the average.
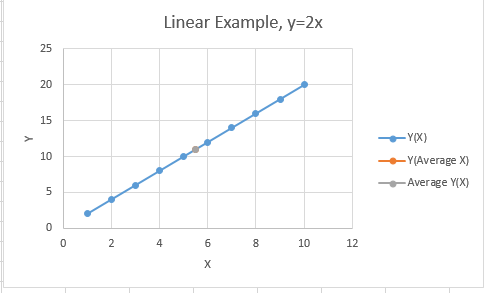
Let’s start with a linear function, like y=2x, with x=[1,10]. If you average all the x values, you get 5.5. Y(Average X) (orange) = Average Y(X) (grey)=11. Everything works out. The average of the function (Average Y[X]) is equal to the function of the average (Y[Average X]).
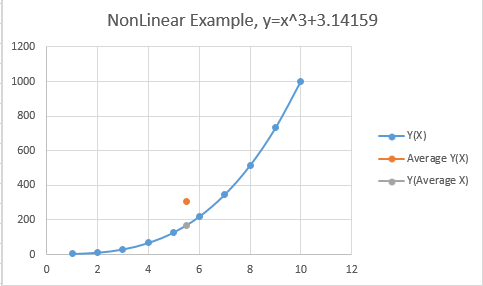
However, what if you have a non-linear function? In this case, the average X value is still 5.5. If you take the average of the y values, you get 305.64159 (orange). However, if you do the Y(5.5), you get 169.51659 (grey). In this case, the average of the function does not equal the function of the average values.
Alright, this is cool. It makes sense, but what does it really mean? Denny points to 2 main conclusions: only in linear cases is the average of the function equal to the function of the average, and the shape of the function can determine how far off-base an average actually is.
This fallacy is also saying you cannot use data about the group to make assumptions about the individual.
Let’s start out with a simple scenario people are probably all too familiar with: the college classroom. Let’s choose two intro-physics classes, one of which has an average grade of 85 and the second an average grade of 67. The fallacy is this: it is wrong to compare individuals of two different groups based on the averages of the groups. You cannot at random take a student, Jimmy, from the first section and a student from the second section, Carl, and say that Jimmy has a better grade than Carl.
This is because the average tells you nothing about the spread of grades. It could be that section A has a bunch of students that average almost exactly 85 in their grades, but section B could have half the students averaging 40 and the other half averaging 95 ( a bi-modal distribution), so the total combined average of the course would be 67. With this particular example, you have a 50/50 chance that Carl has a better grade than Jimmy, but you couldn’t tell that just from looking at the class averages.
The above example has to do with taking the average of a group that is performing non-linearly. However, this can also be applied to an individual that is performing non-linearly. Because it’s such a beautiful example, I’m just going to use Denny’s.

Here we have an animal. On the x-axis is temperature and on the y-axis is some sort of characteristic. It can be its swimming speed, it can be metabolism, it can be likelihood to go hunting, whatever. In Graph A we have an animal, Bob, that can function well over a variety of temperatures, and in graph B we have Larry, which really only likes to live in Florida (doubt me? go check Florida’s temp range). Taking the average between two points on either side of the peak results in a non-accurate y-value for T_opt, and then using a wider range of x-values creates an even larger difference. Taking the average of anything from these graphs would be pretty useless, and comparing Bob’s average to Larry’s beyond useless.
Jensen’s inequality can be found anywhere from Van der Waal forces to biomechanics or species diversity. It’s just a simple mathematical principle, but it can be easy to overlook if you’re not careful.
This was just a short post. I wanted to clear my head and write something short and sweet, since most of the other blog posts I’m working on are long and inching along. I hope some of you found this interesting or useful. As always, comments and feedback are welcome.
Cheers,
Z
Other sources:
Welsh et al. The Fallacy of Averages. The American Naturalist 132(2):277-288. 1988. (pdf).
Featured Image Source
